Table Of Contents


The term “SAS” (pronounced as SASS) originally stands for Statistical Analysis System. History of SAS Software begins in the late ‘60s and early ‘70s as a statistical package which was developed at North Carolina State University by James Goodnight, Anthony Barr and John Sall, to analyse the agricultural data to improve crop yields.
SAS is a collection of software modules owned and maintained by SAS Institute Inc. In recent years, it has been enhanced to provide state-of-the-art data mining tools and programs for web development and analysis.

Evolution of SAS Software
In 1960 it was a statistical tool; where only the drag and drop concept was applied. As mentioned earlier, at that time it was only used to analyse agricultural data to improve the crop yields. In 1970, SAS was a package. In 1980, SAS was upgraded as a language. SAS was developed from C language.
Difference between Package & Language
A package is a way to carry a group of related software and support files. But we can not modify or customize our own thing here. For example, Tally is a package. Whereas, a Language is basically a tool, consist of syntax rules and semantics, that we use to write a computer program.
In language there is no limit like a package, we can also develop a package using a language. In other words, the package is a box for holding things and a language is a procedure for making the parts that go into the box.
In 1990, SAS was software, it includes both package and language. So, SAS can also extend as Statistical Analysis Software. SAS was further developed in 1993 and 2000 with the addition of new statistical procedures, additional components and the introduction of JMP. Later in 2010, social media analytics product and the customer relationship management features were introduced in SAS.
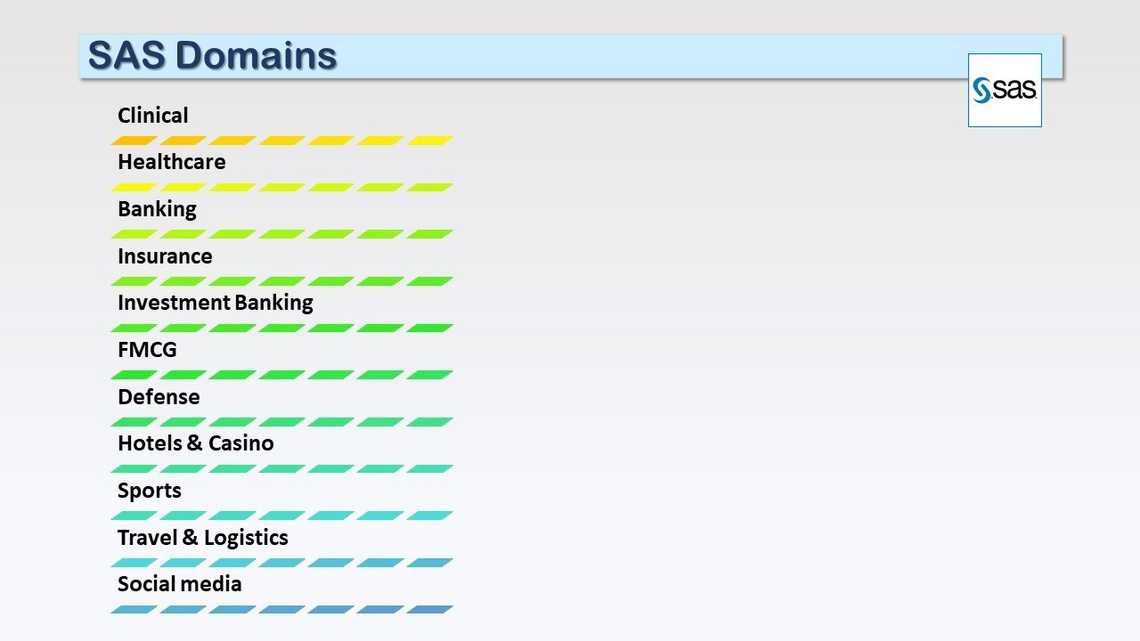
SAS Functionality & Domain
SAS is an integrated system of software solutions that enables programmers to perform the following “tasks”:
- Data entry, retrieval, management and mining
- Report writing and graphics design
- Statistical and mathematical analysis
- Business planning, forecasting and decision support
- Operations research and project management
- Applications development
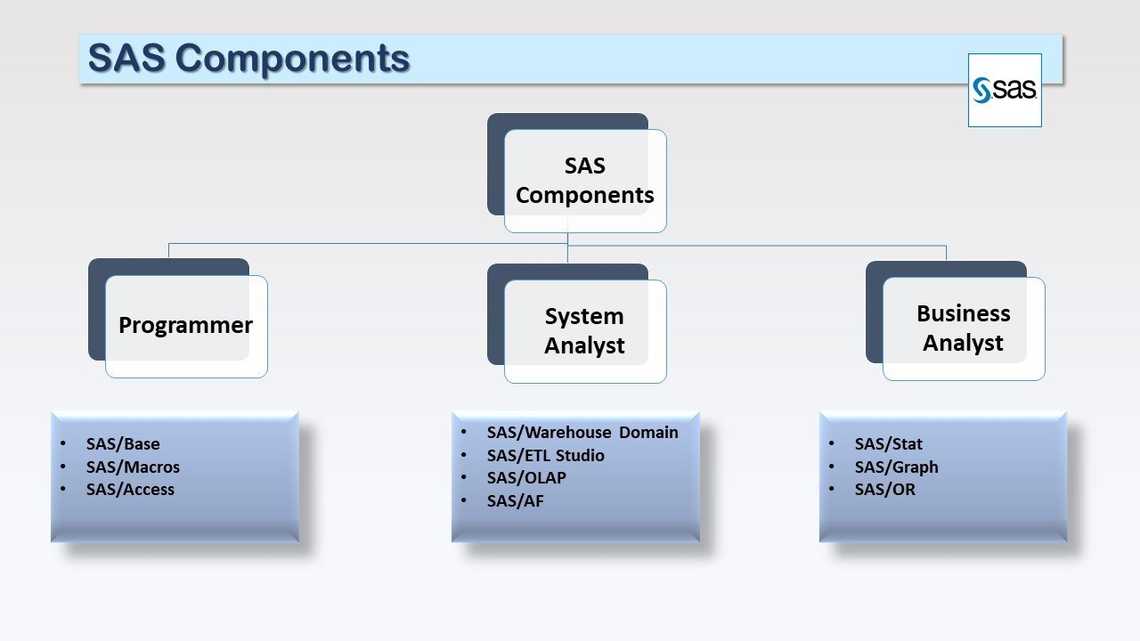
SAS Components
SAS has different components and each one having different functionalities.
SAS/Base – Basic procedures and data management
SAS/Macro-—To create a macro
SAS/Access—To access the dataset
SAS/STAT – Statistical analysis
SAS/GRAPH – Graphics and presentation
SAS/OR – Operations research
SAS/AF – Applications facility
SAS/OLAP & SAS/ETL Studio-- Business intelligence Tool
How you use SAS depends on what you want to accomplish. Some people use many of the capabilities of the SAS System, and others use only a few. A programmer basically uses SAS/Base, SAS/Macro and SAS/Access.
Likewise, the Business analyst uses SAS/STAT, SAS/Graph, SAS/OR etc. while, system analyst frequently use SAS/OLAP & SAS/ETL Studio, SAS/AF, SAS/warehouse domain.
There are 4 essential tools in SAS
- Data access tool
- Data Management tool
- Data Analysis tool
- Data Presentation/Reporting tool.
Data Accessing
SAS can access both relational databases as well as the non-relational database.
SAS can extract the data from different databases, for example, Oracle DB, Access, Teradata, Excel, notepad etc. by using wizard method, Infile statement, library ref, SQL procedure and Import procedure.

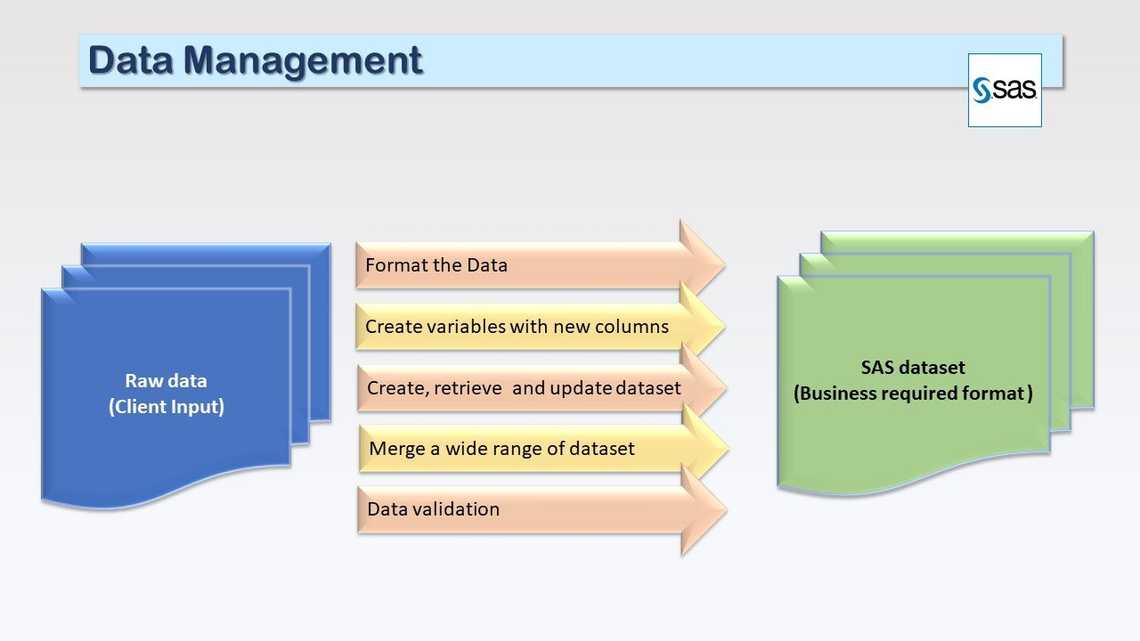
Data Management
Transformation or conversion of raw data into SAS required format or business required format is called data management. After importing the raw data, from other sources or databases to the SAS environment, it is impossible to opt for data analysis or any kind of reporting directly.
Therefore, data management is essential to transform raw data into any required format. There are many ways of transformation of data in SAS. Such as, create variables with new columns, format the data, merging with other datasets, updating the dataset, cleaning the dataset and validation of dataset etc.
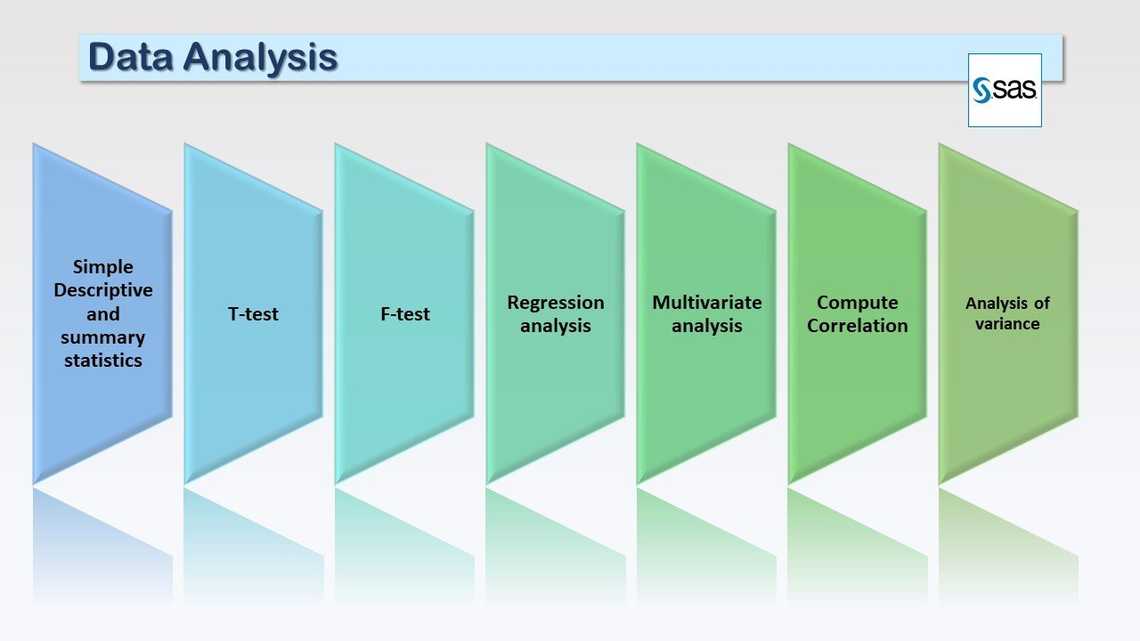
Data Analysis
In SAS, we can use various methods to analyse our data.
- Compute simple descriptive and summary statistics (by using means, summary and univariate procedure).
- Compute the relationship between two variables (by using Pearson’s, Spearman’s, Kendall’s, Hoeffding’s correlation procedure)
- Figure out the rank, for example, the top 10 companies in business analytics, by using the RANK procedure.
- Likewise, we can apply ANOVA, T-test, F-test and regression as per the requirement.
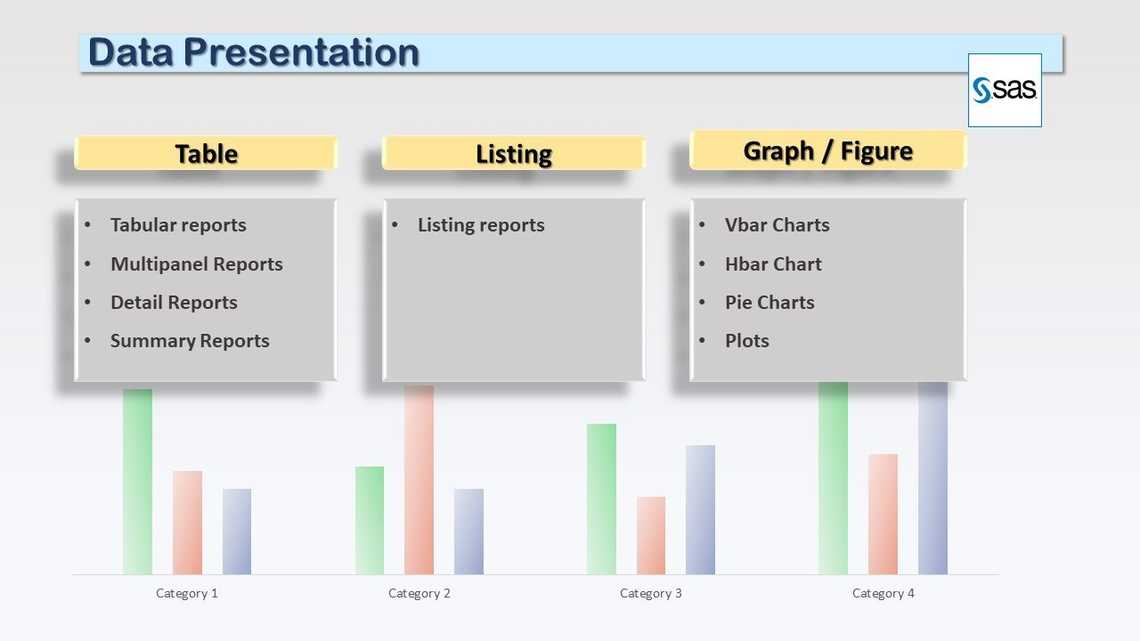
Data Presentation
SAS produces different kinds of Tables, listings and graphs to represent the data. In other words, we can say SAS can produce the reports in
- TLG/TLF format.
- Listing report
- Tabular reports
- Multipanel Reports
- Detail Reports
- Summary Reports
- Vbar, Plots, Pie-chart etc.