


Table Of Contents


Introduction to Simple Linear Regression
Linear regression is a statistical technique that allows you to predict the values of an unknown variable based on the relationship between this variable and one or more known variables.
For more information on ANOVA, see our guide on One Way Anova in SAS.
This article will introduce you to linear regression, including its use, what type of data it requires, and some common mistakes people make when using it.
An example of Linear Regression
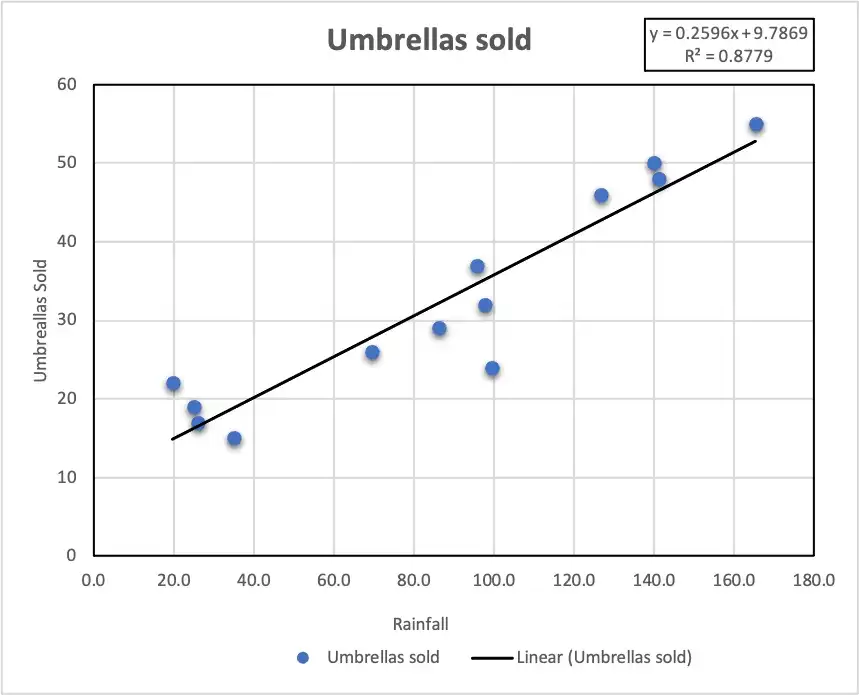
The dependent variable, Umbrellas Sold (the y-axis), is regressed against each independent variable, Rainfall (x-axis).
| Explanatory | Response | |
|---|---|---|
| x | y | |
| Period | Rainfall | Umbrellas sold |
| Jan-18 | 126.7 | 46 |
| Feb-18 | 97.8 | 32 |
| Mar-18 | 86.2 | 29 |
| Apr-18 | 99.6 | 24 |
| May-18 | 35.0 | 15 |
| Jun-18 | 25.0 | 19 |
| Jul-18 | 26.0 | 17 |
| Aug-18 | 19.7 | 22 |
| Sep-18 | 69.5 | 26 |
| Oct-18 | 95.7 | 37 |
| Nov-18 | 141.3 | 48 |
| Dec-18 | 165.4 | 55 |
| Jan-19 | 140.0 | 50 |
In this graph, we can see that as rainfall increases, Umbrellas sold also increase.
Linear regression equation
Mathematically, linear regression is defined by this “equation”:
y = bx + a + ε
“Where”:
- x is an independent variable.
- y is a dependent variable.
- a is the Y-intercept, which is the expected mean value of y when all x variables are equal to 0. On a regression graph, it’s the point where the line crosses the Y-axis.
- b is the slope of a regression line, which is the rate of change for y as x changes.
- ε is the random error term, which is the difference between the actual value of a dependent variable and its predicted value.
For our example, the linear regression equation takes the following “shape”:
Umbrellas sold = b * rainfall + a
To create a Linear Regression Analysis in Excel, refer to this article.
Type of Data Linear Regression Needs
Linear regression requires knowing both y values and at least one x value for each corresponding pair of data points.
Why Use Linear Regression?
Linear regression is the best tool for predicting a value of an unknown variable based on one or more known variables. It does not matter whether your data are continuous, categorical, binary, etc., linear regression will work if there is some monotonic relationship between your x and y variables.
Common Mistakes Made While Using Linear Regression
One of the most common mistakes is to include too many predictors into a model that should only have one or two predictors at maximum, especially when your sample size is large and you’re worried about overfitting.
Linear Regression Modeling
This Is the simplest of all statistical models. It is used when you want to establish a relationship between two variables, one independent variable, and the other dependent, meaning that it’s an attempt at explaining how changes in one affect changes in another.
You can view linear Regression Modeling as fitting lines through data points. Linear Regression Modeling can be used in many situations.
“Example”: predicting sales of a product based on marketing data, forecasting stock prices using financial indicators, or determining blood pressure readings vs. age (dependent) concerning body mass index.
Linear Regression Analysis
It shows the relationship between two variables; one that you are trying to predict (dependent or outcome variable) and another that affects it (independent or explanatory variable). The most common example of Linear Regression Analysis is predicting a stock’s future value based on historical data. The following factors are included in this “analysis”:
- Dependent Variable (Y)
- Independent Variables (X)
The first step to conducting any regression analysis is identifying your variables and setting up an equation that the model tells us about the direction of change in Y when we move along X. It also helps us determine how much a change in X affects changes in Y.
Linear Regression Modeling can be easily conveyed in a graph called the “Scatter Diagram”. The points on this diagram are plotted based on the changes in X and Y values, respectively, with each variable being represented by two perpendicular axes.
Least-Squares Regression Line
The least-squares regression line is the best-fitting straight line that minimizes the sum of squared errors. This means it reduces all data points (in our case Y values) around this line, making them smaller than they would be otherwise.
A good model can mean significant savings for businesses or organizations with large amounts of data points. The least-squares regression line is a good model; however, it may not always apply to your data.
How to find the Least Squares Regression Line?
To find the least square regression line, we will have to find the slope and y-intercept.
Now you can calculate this by finding the sum of squared errors (y) from each point in the data set rather than two variables.
We use the least-squares regression line to find out the ‘average’ or mean of a linear trend in data points available for us; by eliminating or minimizing errors found on our graph after plotting it.
This means you can predict future values (on X-axis) based on past events/data sets (Y-axis).
Making Predictions with Linear Regression
First of all, get the slope and y-intercept from the scatter diagram made on the graph. After that, put your points into the equation of the least square regression line and solve for X by replacing the Y value with the new one found on-axis.
This way, you will be able to predict future values based on past events/data sets.
Now, that you know how to find least squares regression line, slope, and intercept; it is time for us to understand what assumptions are required to make predictions with the linear regression “model”:
The second assumption is that there should be no significant autocorrelation which means errors of adjacent values shouldn’t correlate with each other, meaning they are independently random from one another.
To check for these assumptions, residual plots can be made by plotting standardized residuals vs. fitted values on a scatter plot.
If the points appear random, this means assumptions are met. If not, you will have to go back to the data set or re-fit your regression line with different methods by adding more explanatory variables into the model, also known as the stepwise method.
Bottom Line
Linear regression is a statistical technique that can be used to predict values of unknown quantities. The linear regressions you’ve seen in other textbooks are just one way to do it, but there are many others.
This article has given the most basic introduction to this topic and hopefully provided some new insights into what’s possible with linear regression—and why it’s worth learning.