The student’s TTest is the most used statistical test for comparing two means or an observed mean with a known value. When comparing the means of more than two groups, an analysis of variance (ANOVA) is performed.
Syntax
PROC TTEST < options > ;<br>CLASS variable ;<br>PAIRED variables ;<br>BY variables ;<br>VAR variables ;<br>FREQ variable ;<br>WEIGHT variable ;
PROC TTest OPTIONS
The following options can appear in the PROC TTEST statement:
<strong>ALPHA=specifies the confidence interval. The default value for ALPHA is 0.05;</strong>
<strong>CI=EQUAL</strong>indicates an equal-tailed confidence interval.- CI=UMPU indicates an interval based on the uniformly most powerful unbiased test of H0: σ = σ0;
- CI=NONE option requests that a no-confidence interval be displayed for σ;
- COCHRAN requests the Cochran and Cox approximation of the probability level of the approximate t statistic for the unequal variances situation.
- DATA= SAS-data-set specifies the name of the SAS data set for the procedure.
<strong>H0=m</strong>requests tests against m instead of 0. By default=0.
PROC TTest Statements
The following statements are available in PROC TTEST:
CLASS Statement
Syntax : CLASS variable;
The CLASS statement is used to give the classification or grouping variable name that must accompany the PROC TTEST statement for two independent sample cases.
Suppose the CLASS statement is used without the VAR statement, all the numeric variables in the input data set excluding those appearing in the CLASS, BY, FREQ, or weight statement. The CLASS variable should only have two levels, which can be numeric or character variables.
The CLASS statement should be omitted for the one sample or paired means comparisons.
PAIRED Statement:
Syntax : PAIRED PairLists ;
PAIRED statements can be used only for Paired Comparisons. Pair Lists identify the variables to be compared in paired comparisons. You can have one or more pair lists. You cannot use the CLASS and VAR statements with the PAIRED statement.
BY Statement :
Syntax :
BY variables;
BY Statement in PROC TTest is used to obtain separate analyses on observations in groups defined by the BY variables. The input dataset needs to be sorted in order of the BY variables.
Suppose your input data set is not sorted in ascending order. In that case, you can specify the BY statement option with NOTSORTED or DESCENDING in the BY statement for the TTest procedure. You can also create an INDEX on the BY variables.
VAR Statement:
Syntax:
VAR variables;
The variables used in the analyses are named in the VAR statement. One-sample comparisons are conducted when the VAR statement is used without the CLASS statement, while group comparisons are conducted when the VAR statement is used with a CLASS statement.
If you omit the VAR statement, all the numeric variables available in the input dataset are used for analysis, excluding the variables in the BY, CLASS, FREQ, or WEIGHT statement.
You can use the VAR statement with one and two sample TTest, but it cannot be used for PAIRED comparison.
FREQ- Statement :
Syntax : FREQ variable;
FREQ statement Identifies a variable that contains the frequency of occurrence of each observation. PROC TTEST treats each observation as if it appears n times, where n is the value of the FREQ variable for the observation.
If the value is not an integer, only the integer portion is used, and if the frequency value is less than 1 or missing, the observation is excluded from the analysis.
Each observation is assigned a frequency of 1 if you don’t specify the FREQ statement.
The FREQ statement cannot be used if the input data set contains summary statistics instead of the original observations.
WEIGHT Statement
Syntax:
WEIGHT variable ;
The WEIGHT statement weights each observation in the input dataset by the value of the WEIGHT variable. The values of the WEIGHT variable can be non-integral numbers, and they are not truncated.
If you don’t use the WEIGHT statement, each observation is assigned a weight of 1. If you have observations with negative, zero, or missing values for the WEIGHT variable, then these variables are not used in the analysis.
The WEIGHT statement cannot be used if your input data set is summary statistics, not raw data.
Performing a one-sample TTest
In a one-sample TTest, you obtain a random sample from some population and then compare the observed sample mean to some fixed value.
A one-sample TTest compares an observed mean with a known value. The one-sample t-test determines if there is enough evidence to dispute the claim.
The hypothesis for a one-sample TTest is:
:The population mean is equal to a hypothesised value.
:The population mean is not equal to a hypothesized value.
Assumptions
The primary assumptions for one sample TTest are that the population from which the random sample is selected is normal. If the data are not normal, non-parametric tests like sign and signed-rank tests are used.
In SAS, there are two procedures by which you can perform a one-sample TTest.
In PROC UNIVARIATE, you can specify the value of using MU0=value.
PROC UNIVARIATE MU0=4;
VAR LENGTH;
RUN
would request a one-sample TTest of the null hypothesis that
The second method in SAS for performing a one-sample TTest is the PROC TEST procedure.
PROC TTEST H0=4;
VAR LENGTH;
RUN
Example:
Its manufacturer reports a certain medical implant component to be 4 cm in length. To test the reliability of the manufacturer clay, a random sample of 20 of the component is collected.
For this example, we will compare the mean of the variable length in the clinic group for a pre-selected value of 4 and an alpha value of 0.1:
proc ttest data=data.clinic h0=4;
var length;
run;
The Results
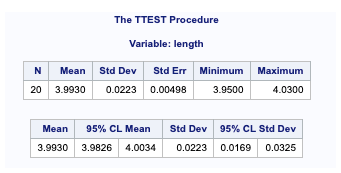
- Variable – This is the name of the variables used for the comparison.
- N – This is the number of observations used in calculating the TTest. (excluding missing values)
- Mean – This is the mean of the variable.
- Std Dev – This is the standard deviation of the variable.
- StdErr – This is the estimated standard deviation of the sample mean.
- Minimum – This is the minimum value in the input dataset.
- Maximum – This is the maximum value in the input dataset.
- 95% CL Mean – These are the lower and upper bound of the confidence interval for the mean.
- 95% CL Std Dev – These are the lower and upper bounds of the confidence interval for standard deviation.

- DF – The degree of freedom is the number of observations minus 1.
- t Value – This is the value of the Student t-statistic. It is the ratio of the difference between the sample mean and the given number to the standard error of the mean.
- Since the standard error of the mean measures the sample means variability, the smaller the standard error of the mean, the more likely our sample mean is close to the true population mean.
- Pr > |t| – The p-value is the two-tailed probability computed using the t distribution. It is the probability of observing a greater absolute value of t under the null hypothesis, for a one-tailed test, half this probability.
- If the p-value is less than the pre-specified alpha level of 0.05, we will conclude that the mean is statistically significantly different from zero. In this example, the p-value for length is greater than 0.5. So we conclude that the mean for length is not significantly different from 4 cm.
Graphs:
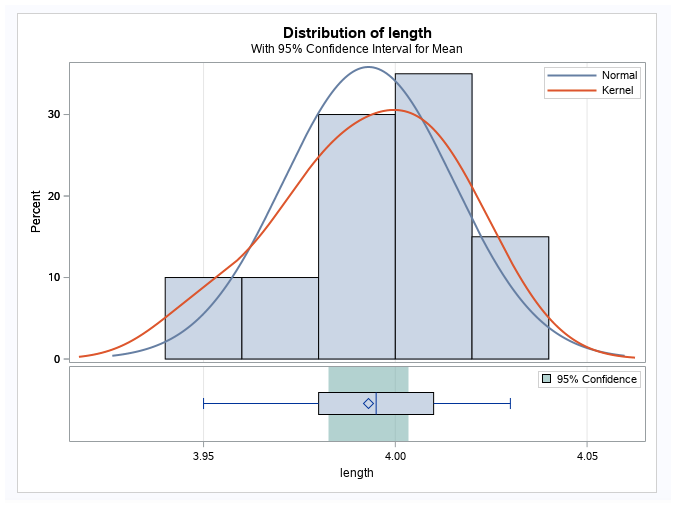
For the left graph, the blue curve is a normal curve based on the mean of 3.993 and a standard deviation of 0.022. The red curve is a kernel density estimator.
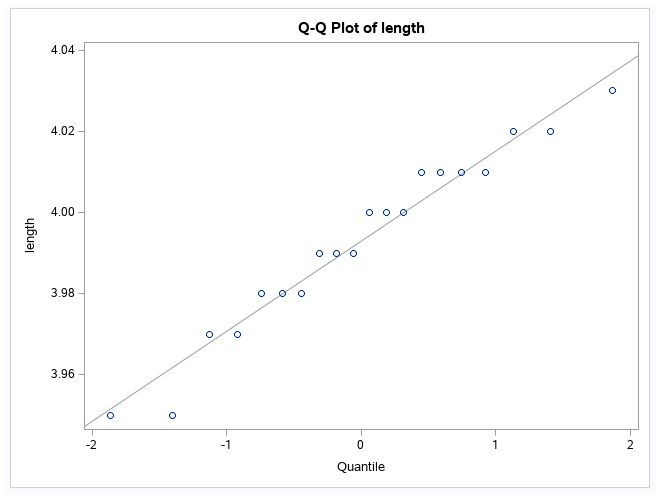
In the Right graph is a Q-Q plot that helps you assess the data’s normality.
Two sample TTest
The SAS PROC TTEST procedure tests the equality of means for a two-sample (independent group) TTest.
The hypothesis for a two-sample TTest is:
:The population means of the two groups are equal.
:The population means are not equal.
Assumptions:
The underlying data for the two-sample TTest are random samples and are independent. Another assumption is that the populations are normally distributed with equal variances.
Example:
A biologist experimenting with plant growth designs an experiment in which 15 seeds are randomly assigned to one of the two fertilizers, and the height of the resulting plant is measured after 2 weeks. She wants to know if one of the fertilizers provides more vertical growth than the other.
proc ttest data=data.grow;
class brand;
var height;
run;
Output:
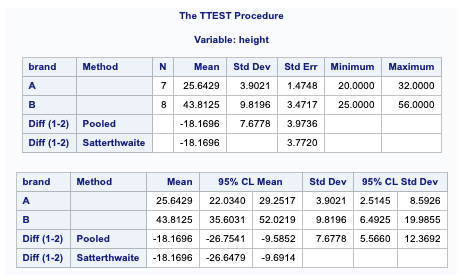
The first table is the same as one sample TTest, but the information is for each group and the mean difference.
The pooled variance estimator is a weighted average of the two sample variances, with more weight given to the larger sample.
Satterthwaite is an alternative to the pooled-variance TTest and is used when the assumption that the two populations have equal variances seems unreasonable.
The second table again gives the standard deviations along with 95% confidence intervals for each group’s means and standard deviations.
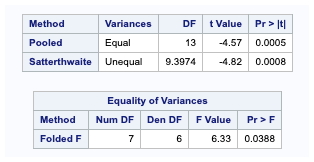
The third table gives the results of the two TTests. The T-test based on a pooled variance estimate has a p-value of 0.0005, while for the Satterthwaite version, p=0.0008.
The fourth table gives the results of the F-Test for deciding whether the variance can be considered equal. The P-value for this test is 0.0388, so at a 0.05 significance level, we would consider that the variance is not equal, and it appears that the variance of Brand B is larger than that for Brand A.
Graphs:
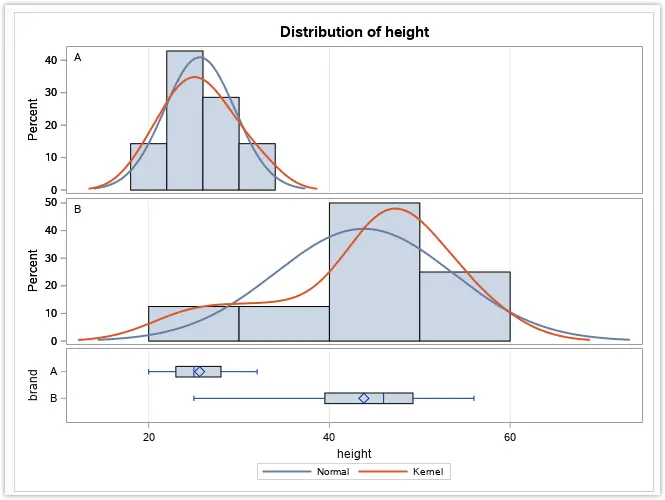
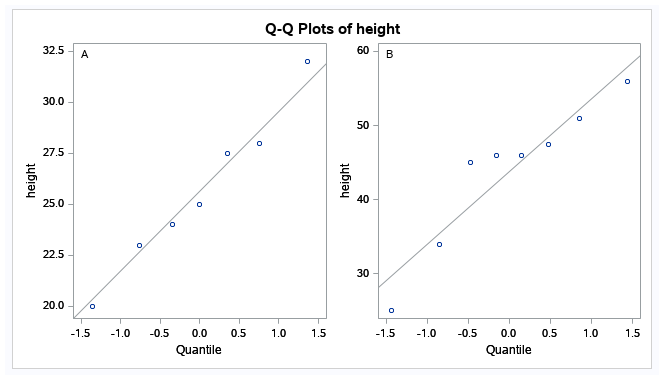
The graphical representations show both groups’ histograms, normal curves, kernel density estimators, and box plots. A Q-Q plot is also included in the output, which is shown below.
Performing a Paired TTest
Paired comparisons use the one-sample process on the differences between the observations, such as before and after situations where both observations are taken from the same or matched subjects.
Paired comparisons can be made between many pairs of variables with a single call to PROC TTEST Procedure.
An asterisk separates variables or lists of variables (*) or a colon (:). The * tells SAS to compare each variable on the left with each variable on the right.
The “:” tells SAS to compare the first variable on the left to the right, the second variable on the left and the second on the right, and so on.
It is important to use the same number of variables on the left and the right when the colon is used.
| PAIRED Statements Examples | The Comparisons |
| PAIRED A*B | A-B |
| PAIRED AB CD | A-B and C-D |
| PAIRED (A B)*(C D); | A-C, A-D, B-C, and B-D |
| PAIRED (A B)*(C B); | A-C, A-B, and B-C |
| PAIRED (A1-A2)*(B1-B2); | A1-B1, A1-B2, A2-B1, and A2-B2 |
| PAIRED (A1-A2):(B1-B2); | A1-B1 and A2-B2 |
Example:
An input dataset contains the variables WBEFORE and WAFTER that represents before and after weight on a diet for 8 subjects. Perform a test to conclude if the average weight loss before and after the diet is not equal to 0.
proc ttest data=data.weight;
paired wbefore * wafter;
run;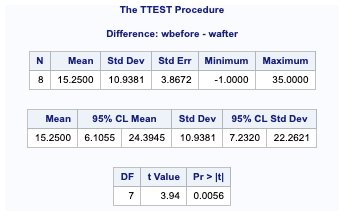
From the above results, the P-value for this test is 0.0056, which provides evidence to reject the null hypothesis that before and after weight loss is not 0.
The 95% confidence interval on the difference(7.23,22.26) indicates that the population’s mean weight loss could lie between these two values. In either of the case, it appears that the mean weight loss is greater than 0.
References:
SAS Essentials: Mastering SAS for Data Analytics, 2nd Edition


